System Logging and Monitoring is administrator best friend. It’s like an administrative partner that is always at work, never complains, never gets tired, and is always on top of the things.
SIEM and System Diagnostic in Details
DCS MONITORING
FEATURES
Finally, all your event and log data from DCS and Control Network available and accessible in one central location. Discover and resolve issues faster. Keep customers happy with predictive maintenance, better performance by proactively monitoring key indicators and exceptions across the entire system. Eliminate the information bottleneck between your teams and keep compliance with Cyber Security Frameworks.
- Big Data Capturing & Analytics
We collect, store, index, correlate, visualize and analyze everything classified as log or event in DCS environment: NetFlow, Syslog, SNMP Traps, Windows Event Logs, Experion Diagnostic Capture Logs, Honeywell PHD Server Logs, SQL Server Logs, Web Services Logs, EPKS Event2 records, Safety Historian SOE, Any Other Machine Logs.
- System Monitoring
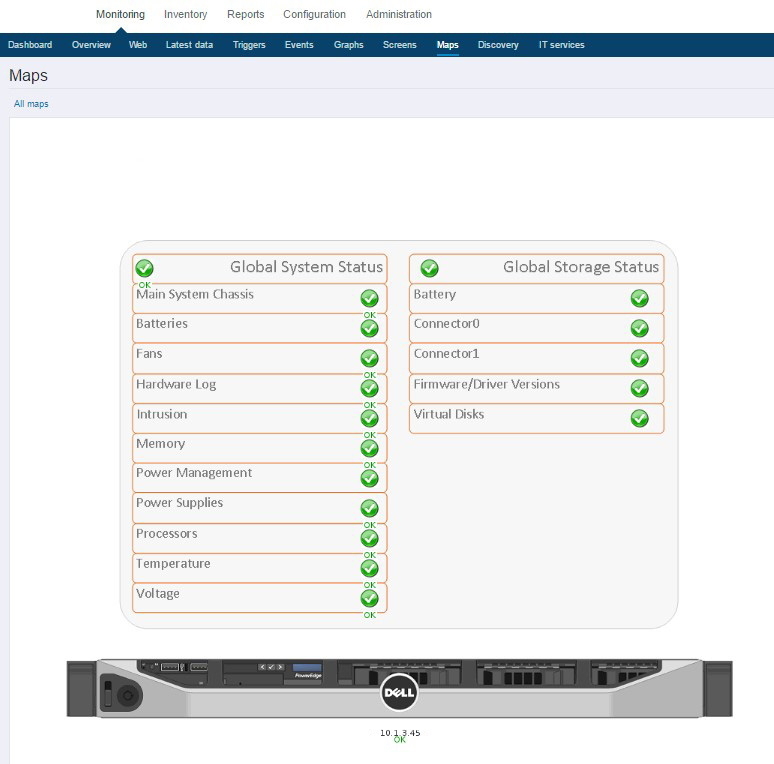
We monitor each physical and virtual machine and mission critical applications for
availability, responsiveness and abnormal parameter trends.
1. NetFlow
NetFlow is the primary network accounting and anomaly detection technology in the industry. Netflow is answering to five questions regarding IP traffic:
- Who is talking to whom?
- Over what protocols and ports?
- For how long?
- At what speed?
- For what duration?
Collect flows from perimeter routers and key internal probes like VMWare distributed switches to allow any traffic correlation reports.
NetFlow allows administrators to identify conditions in the network that are identified as a statistical abnormality when compared to typical traffic patterns gleaned from previously collected profiles. NetFlow is primary information source for mitigating network attacks.
2. SysLog
While NetFlow provides traffic and usage information, Syslog is the source for discover network problems and get internal system notification from managed network devices:
- Device Configuration Change
- Interface up/down
- Access Lists hitting
- Internal errors
- Memory Problems
- High CPU utilization
SysLog and Netflow correlations helps administrators to identify the presence of security threads, compromises and data leaks.
3. Windows Events
Unwatched machines, like unwatched children, invariably end up in a chaotic state. Monitoring the machines using data collector sets, alerts, and events enables you to keep an eye on the system performance and configuration.
Centralized Windows Event analytics saves time in tracking and detection of problems, security log review and plays key role in your compliance initiatives. Effective monitoring often provides warning signs about the upcoming problems, giving you a chance to resolve them before they cause a service disruption.
Collect all event category:
- Security Events
- Application Events
- System Events
- Directory Service Events
- DNS Events
- Hardware Events
- FTE
- HwSnmp
- HwSysEvt
- MasterLogic
Create various useful reports:
- User logon success/fail
- Antivirus update
- Antivirus detection
- Backup tasks success/fail
- Windows service failure
- SQL related events
- DCS related events
- GP update success/fail
- Etc.
4. Application Log Files
Application Log fails contains some of the most valuable raw information that can be gathered from the servers. Centralizing logs saves a lot of time in troubleshooting process. When servers log files are stored only locally, administrator need to individually log into each server to go through the logs and look for any errors or warnings. The log files are also safer in a centralized database because even when log instances are terminated and log files are deleted locally, the centralized logs are unaffected.
Normalize, index and store log data in document oriented database provide a way to identify issues with common cause patterns. Abnormal log trends provide a warning sign for potential application issues.
Collect all server log files:
- EPKS Diagnostic Capture Logs
- PHD Server Log
- RDI Logs
- API Server Log
- RAPI Server Log
- Any Other 3rd party Server Log
Create various correlation reports:
- EPKS W&E Log Report
- EPKS Top Originators
- EPKS Logon & Authentication
- PHD W&E Log Report
- PHD Top Originators
- PHD Logon & Authentication
- PHD Ext Conn Success/Reject
- Etc.
5. EPKS Event2 & Safety Historian
EPKS Event2 table contains essential for Operation and Maintenance information about Process and System Events.
Safety Historian database contains all SOE records generated by Honeywell FSC and SM safety controllers.
Create various correlation reports:
- Top N Actors per Plant Unit
- SIS Operations
- F&G Alarms
- SOE per Plant Unit
- Audible Alarms per Plant Unit
- EPKS System Status
- Operator Messages
- Operator Changes
- Engineering Changes
- Etc.
7. System Monitoring
Monitoring machine performance indicators like CPU, memory, network, disk space, number of running process and etc. is important to avoid adverse situations and ensure that preventive checks took place before system degradation.
Monitoring network devices like routers, switches and firewalls is important to evaluate network utilization, make capacity planning, ensure correct network traffic direction and interface status.
Monitoring valuable server applications like MSSQL, Honeywell PHD, OPC Servers and etc. is important to reduce the risk of failure and minimize downtime.
Monitor every Physical & VM:
- Scan thousands of items
- Calculate thousands of triggers
- Histories all data
- Problem reporting
- Inventory reporting
- Notifications
- Etc.


